Thinking about buying or selling in Myrtle Beach and wondering why prices seem to shift with the seasons? You are not alone. Between tourism cycles, investor activity, and different rules for condos versus single-family homes, the local market can feel complex. This guide breaks down the real drivers behind pricing in Myrtle Beach and Horry County, how to read the numbers, and what to watch in the months ahead so you can make a confident move. Let’s dive in.
Price drivers in Myrtle Beach
Tourism and seasonality
Tourism is a major engine here. Visitor flows and seasonal second-home occupancy influence short-term rental demand, condo listings, and pricing patterns. Summer tends to be the peak for bookings and buyer attention, while many second-home buyers time purchases in the off season when competition can be lighter. Hotel occupancy and local tourism reports are useful early signals for investor interest.
Demographics and migration
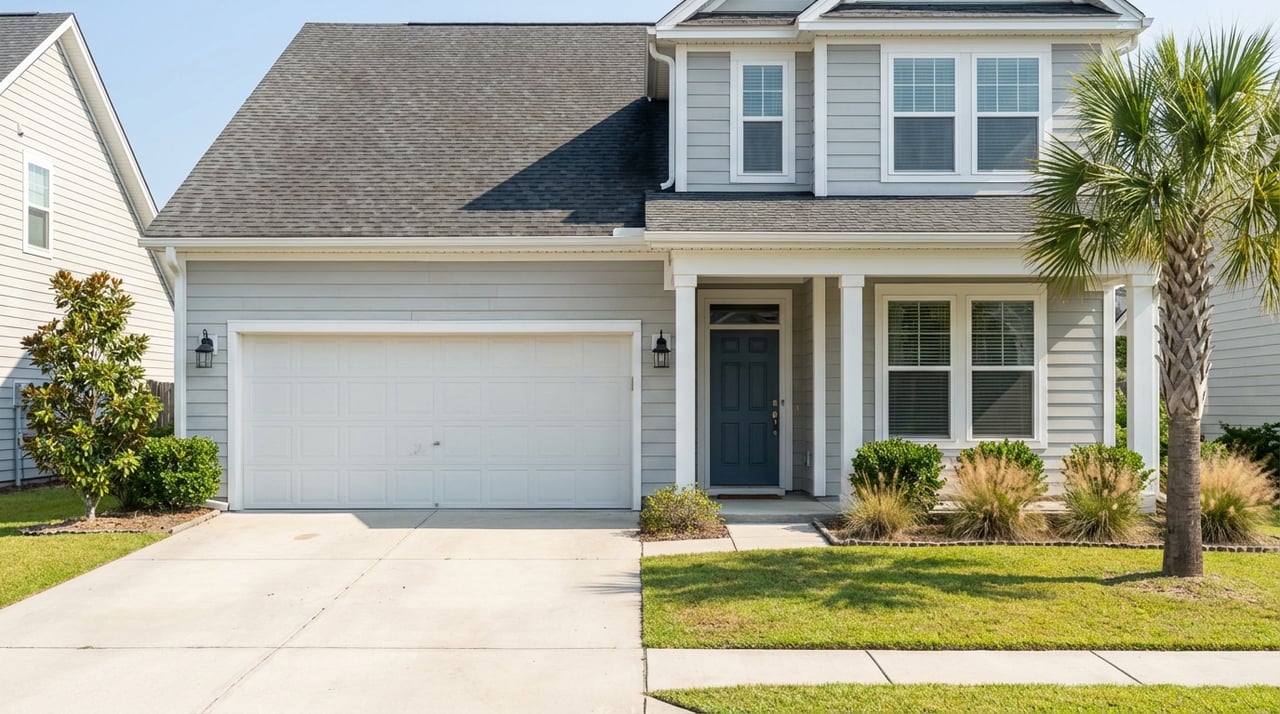
Horry County attracts out-of-state movers and retirees who want a warm climate and relative affordability compared with certain northern markets. This steady in-migration supports demand for single-family neighborhoods and low-maintenance condos. Growth also puts pressure on suburban areas like Carolina Forest and Market Common, where convenience and amenities help sustain values.
Jobs and the local economy
While tourism is central, healthcare, education, retail, and construction also matter. Job growth or cuts in these sectors affect local buying power and price sensitivity. Wage trends and employment in the Myrtle Beach area shape what owner-occupants can afford and how quickly homes go under contract.
Interest rates and costs
Mortgage rates and lending standards directly affect what buyers can pay. Resort markets like Myrtle Beach are sensitive to rate moves, especially for out-of-state buyers and investors using financing. Inflation and construction costs shape what builders can deliver and at what price, which influences both new-home pricing and resale competition.
Supply factors to watch
New construction and permits
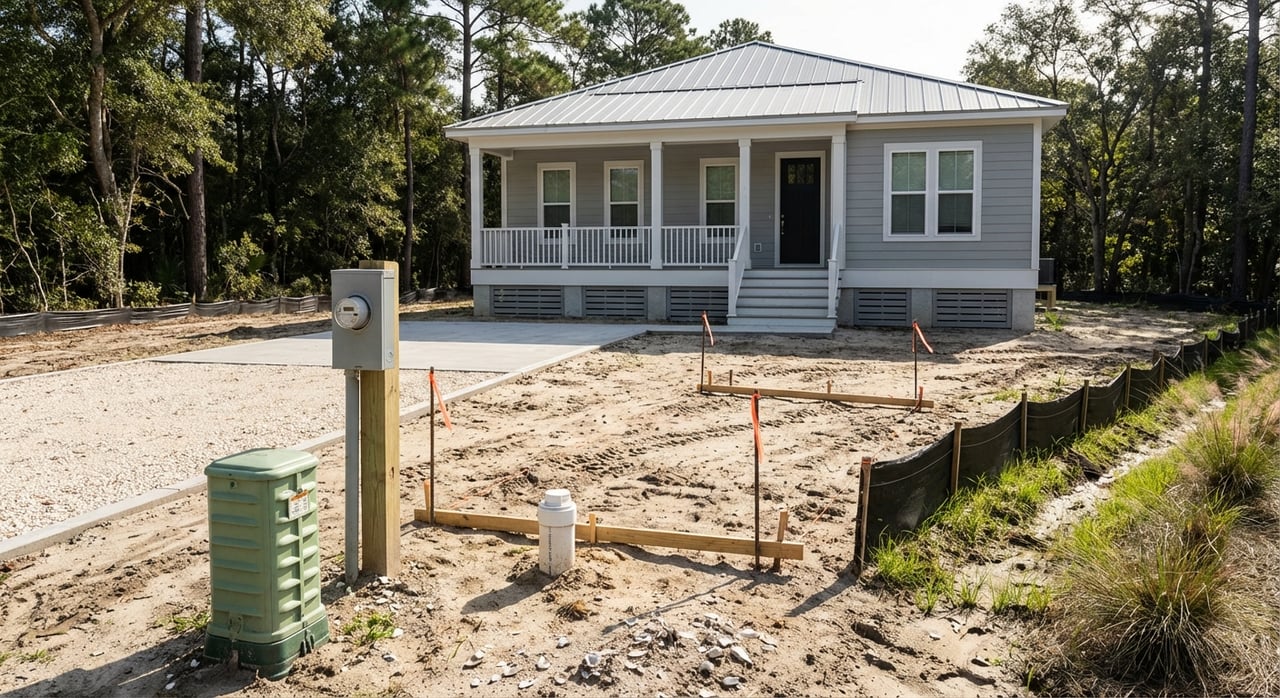
The pace of building permits and housing starts sets the tone for future inventory. More lots and builds around Conway, Carolina Forest, and other inland corridors can ease pressure on prices for single-family homes. A slowdown in permits can tighten supply and support higher prices.
Zoning and land availability
Zoning rules, financing for condo projects, and available land determine what can be built and where. These constraints matter most for long-term inventory and can create pockets of scarcity or, at times, oversupply if one property type comes to market all at once.
Condos vs single-family homes
Condos: what moves prices
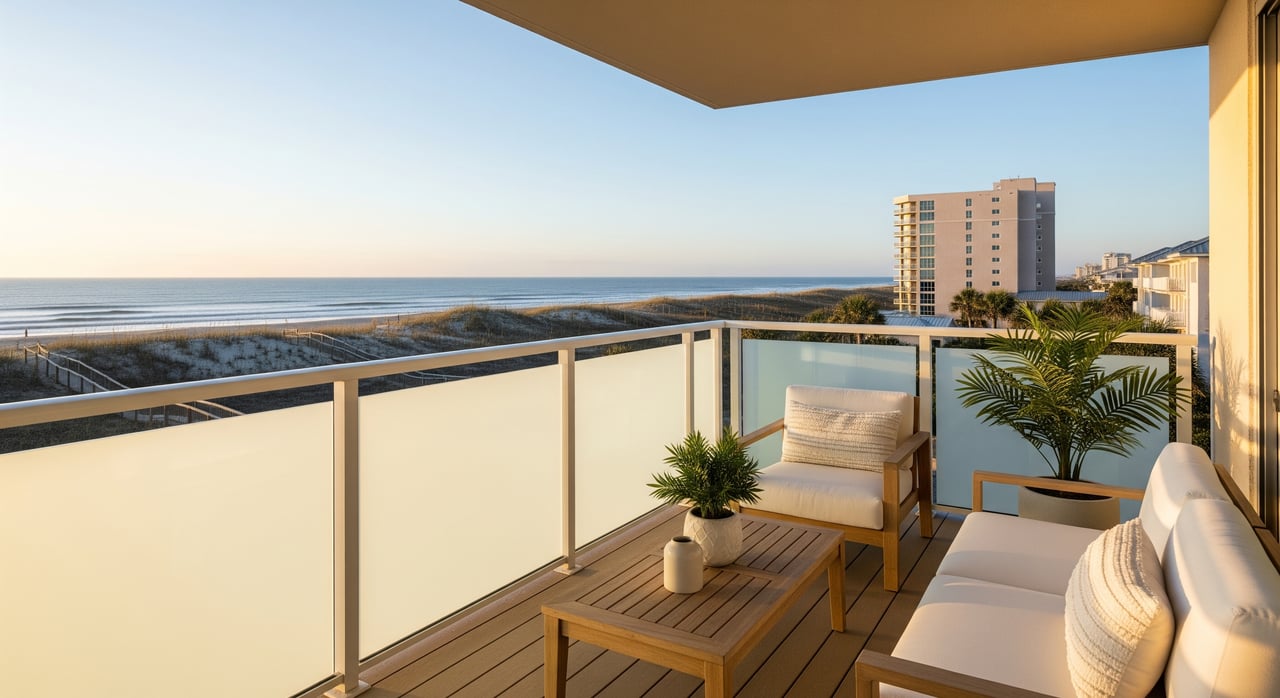
Condos dominate the beachfront and draw both lifestyle buyers and short-term rental investors. What matters most:
- Ocean proximity and views. Oceanfront and ocean-view units typically command higher prices per square foot.
- Building age and amenities. Pools, security, concierge, and onsite services can lift values, but increase monthly costs.
- HOA fees and rules. Monthly dues and association policies affect affordability and rental flexibility.
- STR revenue potential. Occupancy, average daily rate, and seasonality shape investor offers and resale appeal.
Condos often have more seasonal listing patterns tied to tourism, which can make timing a meaningful part of your strategy.
Single-family homes: what moves prices
SFR pricing is influenced by:
- Lot size and neighborhood conveniences. Access to retail, parks, and services supports demand.
- School zoning and commute patterns. These affect buyer pools and pricing power.
- Flood and insurance considerations. Coastal insurance and flood zones can change total monthly cost and buyer budgets.
- New construction vs resale. New builds set reference points for finishes and pricing, especially in growing suburban areas.
Listings for single-family homes tend to be more stable across the year, but local swings in inventory still affect pricing.
Carrying costs matter
When comparing a condo to a single-family home, look beyond list price. Add HOA dues to your projected mortgage, taxes, insurance, and maintenance to compare total monthly costs. For oceanfront properties, factor in coastal or flood insurance and potential assessments so you get a true apples-to-apples view.
Investor and STR influence
Who is buying and why
Two investor profiles are most common:
- Short-term rental investors who target peak-season revenue.
- Long-term hold investors who want year-round cash flow.
Out-of-area, often cash-ready investors can move quickly and influence pricing for certain condo segments, especially near high-traffic beaches and attractions.
STR economics in plain terms
For short-term rentals, performance centers on occupancy, average daily rate, and revenue per available rental over the full year. Seasonality is pronounced. Licensing, taxes, and any inspections or compliance steps reduce net returns, so serious investors bake those into their offers. These dynamics directly affect what investors are willing to pay.
Local rules matter
Short-term rental regulations and enforcement can differ between the City of Myrtle Beach and the broader Horry County area. Permitting rules, allowed unit types, taxes, and neighborhood restrictions may shift investor demand. Anticipated regulatory changes can move the market even before a rule takes effect, so stay current if you are buying or selling a condo with rental potential.
How to read Myrtle Beach market data
Key metrics to track
- Median sale price and price per square foot. Use both to control for mix shifts.
- Months of inventory. Under 3 months often signals a sellers’ market, while over 6 can indicate a buyers’ market. Check by property type.
- New listings and pending sales. Compare year over year for the same month to capture seasonality.
- Days on market and list-to-sale price. These show speed and pricing power.
- Cash sales share and investor activity. Useful for spotting investor-driven segments.
- For STR-oriented condos, track occupancy, ADR, and revenue trends.
Segment the data the right way
- Separate condos and single-family homes in every chart or comparison.
- For condos, segment beachfront versus inland and by bedroom count. A 1-bed oceanfront condo is not the same market as a 3-bed inland unit.
- Compare year-over-year for the same months and use 12-month rolling averages to smooth seasonal spikes.
Avoid common pitfalls
- Do not rely on averages in a market with luxury outliers. Medians are usually more representative.
- Watch for mix shifts. A surge in condo resales or new construction can move the median without changing underlying values.
- Flag small sample sizes in micro-neighborhoods. A few sales can distort trends.
- Always include HOA and insurance in your affordability comparisons.
- Remember that the city and county have different dynamics. Do not blend them without context.
Short-term outlook: what to watch
Indicators over the next 3–12 months
- Mortgage rates. Declining rates can bring sidelined buyers back. Persistent high rates can cap budgets and slow activity.
- Inventory and months of supply. Rising inventory can cool prices. Falling inventory can tighten the market and support gains.
- Tourism and pre-season bookings. Strong booking trends often draw more investor interest in condo segments.
- Permits and construction pipeline. More starts suggest future inventory that can moderate price growth.
- STR regulations. New caps, higher fees, or stricter enforcement can reduce investor demand in some buildings or zones.
- Local employment and wages. Steady growth supports owner-occupant demand.
Seasonal timing tips
- Sellers. Spring and early summer are high-visibility windows as visitor traffic and buyer tours rise. Oceanfront condos can have pronounced seasonal peaks.
- Buyers. Off-season months can bring less competition and more negotiability, though you may see fewer comparable sales to guide pricing. Watch pendings and months of inventory for a read on leverage.
Red flags to monitor
- A sharp rise in off-season listings. This can signal distress or investor exits in specific buildings or areas.
- An STR rule change without grandfathering. That can shrink the buyer pool for some condos quickly.
- A concentrated construction surge in one property type. Oversupply risk can pressure prices temporarily.
- Big jumps in coastal or flood insurance costs. Higher carrying costs reduce affordability and can cap offers.
How The Klas Team can help
You deserve clear, local guidance that matches how buyers actually shop and how buildings really perform. Whether you are weighing an oceanfront condo’s rental potential or choosing between new construction and resale inland, you want a plan grounded in the right data and a fast path to market when it is time to list.
Get a tailored read on your segment, including pricing ranges, seasonality, HOA and insurance comparisons, and a plan to time your move. Schedule a free market consultation with The Klas Team to move forward with clarity and confidence.
FAQs
What drives Myrtle Beach condo prices most?
- Ocean proximity and views, STR revenue potential, HOA costs, building age, and amenities are the biggest movers for condo values.
How do single-family home prices behave inland?
- Lot size, neighborhood amenities, school zoning, flood and insurance factors, and nearby new construction shape pricing and speed.
What is months of inventory and why does it matter?
- It shows the balance of supply and demand; lower levels point to more pricing power for sellers, higher levels improve buyer leverage.
How do HOA fees affect what I can afford?
- Add dues to your mortgage, taxes, insurance, and maintenance to see the true monthly cost compared with a single-family alternative.
How can STR regulations change my resale value?
- Tighter rules or higher compliance costs can reduce investor demand in certain buildings or areas, narrowing the future buyer pool.